File:Fig13 DPjasa06.PNG
From CNBH Acoustic Scale Wiki
Size of this preview: 431 × 600 pixels
Full resolution (625 × 870 pixels, file size: 277 KB, MIME type: image/png)
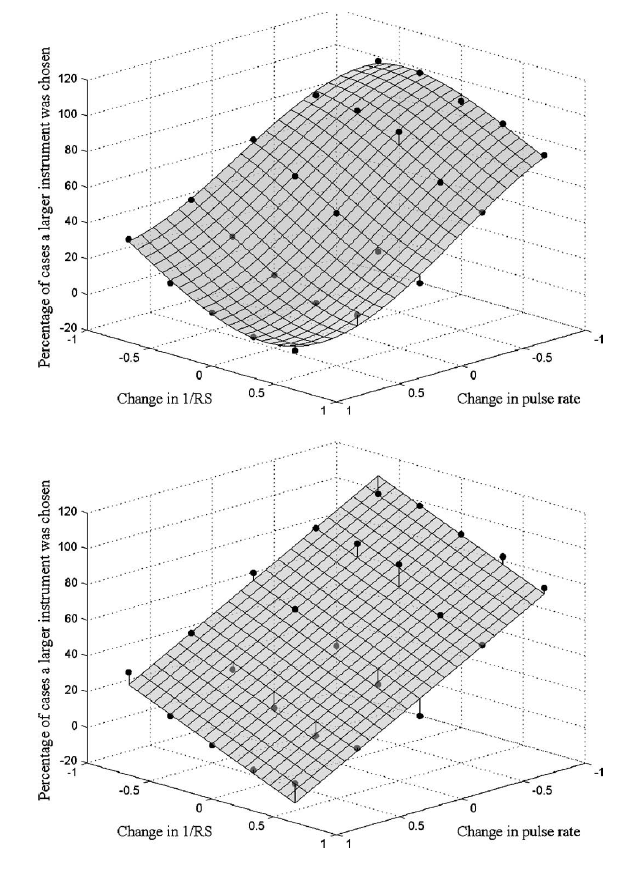
Figure 13. Third-order polynomial and planar surfaces fitted to the within-family error data. The surfaces show the percentage of cases where the listener chose a larger instrument as a function of the difference in PR and RS between the scaled and unscaled versions of the note. The data are plotted on a base-2 logarithmic axis for both the change in PR (the abscissa) and the change in RS (the ordinate).
File history
Click on a date/time to view the file as it appeared at that time.
| Date/Time | Thumbnail | Dimensions | User | Comment | |
|---|---|---|---|---|---|
| current | 15:35, 14 August 2008 | | 625×870 (277 KB) | AlessandroB (Talk | contribs) |
- Edit this file using an external application (See the setup instructions for more information)
File links
The following page links to this file: