File:Fig1 2005.PNG
From CNBH Acoustic Scale Wiki
No higher resolution available.
Fig1_2005.PNG (554 × 420 pixels, file size: 17 KB, MIME type: image/png)
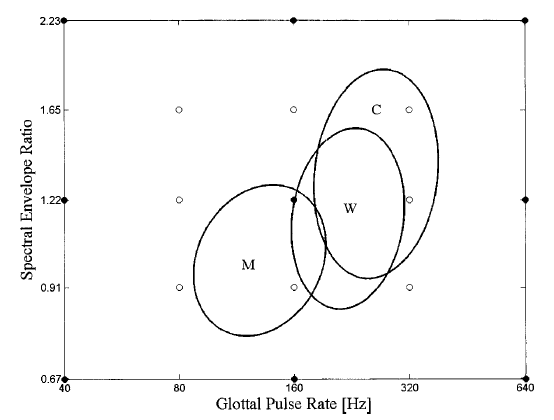
Figure 1. Combinations of GPR and SER values used in the experiments on speaker-size discrimination. Discrimination performance was measured at nine points (solid circles) in the single-vowel experiment, and at seventeen points (solid and open circles) in the speech-like experiment. The three ellipses show estimates of the normal range of GPR and SER values in speech for men (M), women (W) and children (C), derived from the data of Peterson and Barney (1952). 90% of individuals in each category would be expected to fall within the respective ellipse.
File history
Click on a date/time to view the file as it appeared at that time.
| Date/Time | Thumbnail | Dimensions | User | Comment | |
|---|---|---|---|---|---|
| current | 14:51, 13 August 2008 | | 554×420 (17 KB) | AlessandroB (Talk | contribs) |
- Edit this file using an external application (See the setup instructions for more information)
File links
The following page links to this file: