File:Fig3 2005.PNG
From CNBH Acoustic Scale Wiki
No higher resolution available.
Fig3_2005.PNG (554 × 416 pixels, file size: 22 KB, MIME type: image/png)
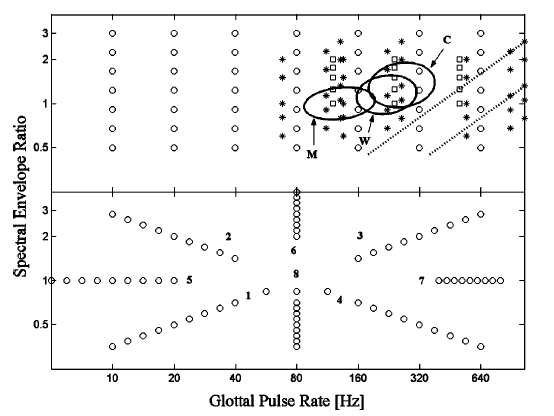
Figure 3. Combinations of GPR and SER values used in the vowel recognition experiments. The SER determines the contraction or dilation of the spectral envelope applied by STRAIGHT during resynthesis (small SER values indicate lengthening of the VTL to simulate larger men; large SER values indicate shortening of the VTL to simulate women and children). The open circles in the top panel show the 7 x 7 sample points used in the surface recognition experiment (GPR values of 10, 20, 40, 80, 160, 320 and 640 Hz; SER values of 0.5, 0.67, 0.91, 1.22, 1.65, 2.23 and 3.0). The three ellipses show the range of GPR and SER in speech for men, women and children (derived from Peterson and Barney, 1952). The open squares show the GPR-SER values used in Assmann et al. (2002) and the asterisks show the GPR-SER values used in Assmann and Nearey (2003). The upper and lower diagonal lines (dotted) show where the fundamental, F0, equals the first formant frequency, F1, or twice F1, for the vowel /e/, respectively. As the GPR/F1 ratio increases across the region between the dotted lines towards higher GPRs or smaller SERs (longer vocal tracts), the distinctiveness of the vowel deteriorates, although the stimulus still sounds vowel-like. The bottom panel shows the eight strips of GPR-SER combinations used in the second vowel recognition experiment.
File history
Click on a date/time to view the file as it appeared at that time.
| Date/Time | Thumbnail | Dimensions | User | Comment | |
|---|---|---|---|---|---|
| current | 15:02, 13 August 2008 | | 554×416 (22 KB) | AlessandroB (Talk | contribs) |
- Edit this file using an external application (See the setup instructions for more information)
File links
The following page links to this file: