File:Fig4 SPjasa05.PNG
From CNBH Acoustic Scale Wiki
Size of this preview: 752 × 600 pixels
Full resolution (885 × 706 pixels, file size: 624 KB, MIME type: image/png)
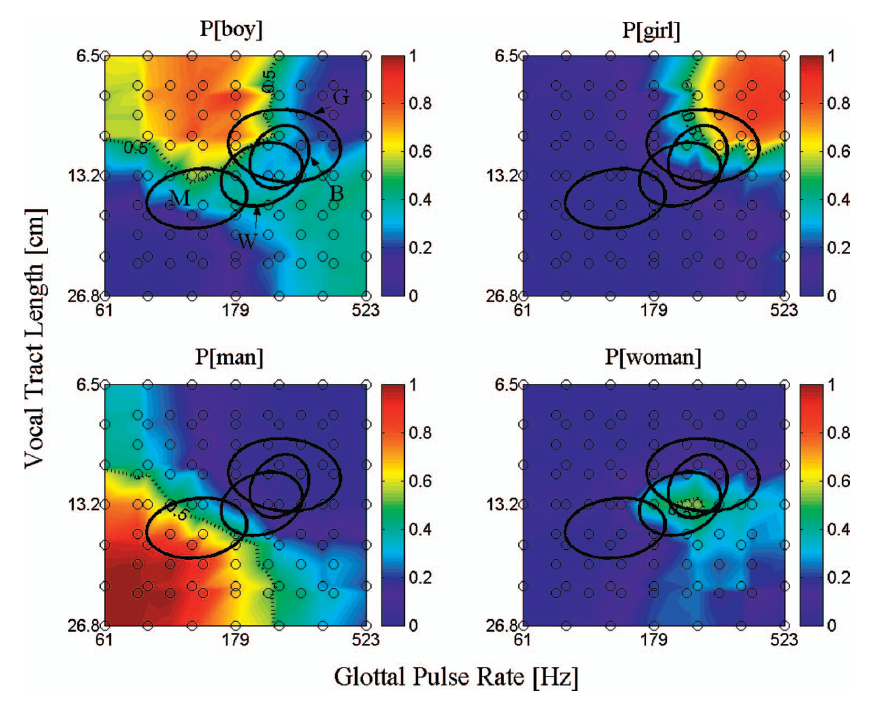
Figure 4. Sex and age categorizations. The data are presented as 2D surface plots with color showing probability of assigning a given GPR-VTL combination to one of four categories (man,woman, boy, or girl). The points where sex/age judgements were collected are shown by the open circles; between the data points the surface was derived by interpolation. At each GPR-VTL point, the probabilities from the four panels sum to 1 (imagine the four separate 2D maps stacked vertically and aligned over each other). The data is averaged across all five vowels and eight listeners (each sample point probability based on 200 trials). The dotted black contour line marks the classification threshold, that is, a probability {\geqslant} 0.50 of consistently choosing one category out of the four available. The region of GPR-VTL values enclosed by this line defines a region categorized as one particular sex or age. The four ellipses show the range of GPR and VTL in speech for men (M), women (W), boys (B), and girls (G), as derived from the data set of Peterson and Barney (1952).
File history
Click on a date/time to view the file as it appeared at that time.
| Date/Time | Thumbnail | Dimensions | User | Comment | |
|---|---|---|---|---|---|
| current | 15:51, 15 August 2008 | | 885×706 (624 KB) | AlessandroB (Talk | contribs) |
- Edit this file using an external application (See the setup instructions for more information)
File links
The following page links to this file: