File:Fig6 2005.PNG
From CNBH Acoustic Scale Wiki
No higher resolution available.
Fig6_2005.PNG (667 × 517 pixels, file size: 166 KB, MIME type: image/png)
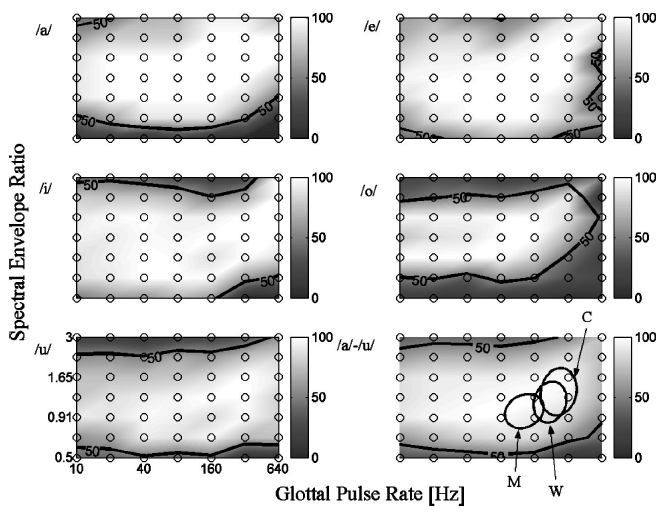
Figure 6. Vowel recognition performance using the surface paradigm. The data are presented as a 2D surface plot with grey tone showing mean percent correct. Sample points are shown as circles with interpolation between data points. The means represent 10 trials from each of five listeners. The data averaged across all five vowels are shown in the bottom-right panel (250 trials/point). The thick black contour marks recognition threshold (50%, d’=1.0) in our 5AFC experiment. The three ellipses (bottom-right panel) show the range of GPR and SER in speech for men, women and children (derived from Peterson and Barney, 1952).
File history
Click on a date/time to view the file as it appeared at that time.
| Date/Time | Thumbnail | Dimensions | User | Comment | |
|---|---|---|---|---|---|
| current | 15:20, 13 August 2008 | | 667×517 (166 KB) | AlessandroB (Talk | contribs) | |
| 15:19, 13 August 2008 |  | 667×517 (166 KB) | AlessandroB (Talk | contribs) |
- Edit this file using an external application (See the setup instructions for more information)
File links
The following 2 pages link to this file: