File:GPRUS02 fig2.PNG
From CNBH Acoustic Scale Wiki
Size of this preview: 413 × 600 pixels
Full resolution (542 × 787 pixels, file size: 120 KB, MIME type: image/png)
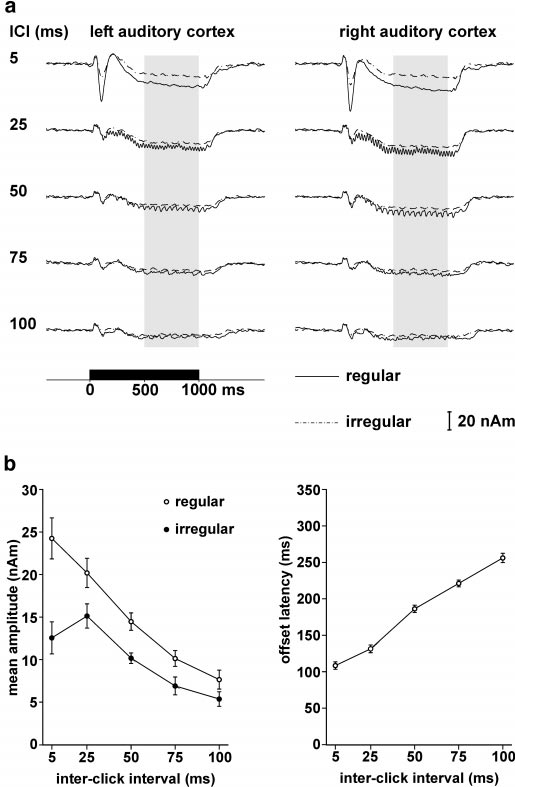
Fig. 2: Source activity in auditory cortex for inter-click intervals (ICIs) of 5–100 ms. (a) Grand average source waveforms. The shaded area shows the latency epoch 500–1000 ms used to calculate the sustained field amplitude. Except at the highest rate, the responses to single clicks are observed superimposed on the sustained fields of the regular click trains. (b) Mean amplitude of the sustained field for the epoch 500–1000 ms post stimulus onset, averaged over both hemispheres (left); offset latency of the sustained field to regular click trains (right) (meanstandard error, n=12).
File history
Click on a date/time to view the file as it appeared at that time.
| Date/Time | Thumbnail | Dimensions | User | Comment | |
|---|---|---|---|---|---|
| current | 10:29, 9 September 2008 | | 542×787 (120 KB) | AlessandroB (Talk | contribs) |
- Edit this file using an external application (See the setup instructions for more information)
File links
The following page links to this file: