File:IP2008JASA Figure 04.png
From CNBH Acoustic Scale Wiki
No higher resolution available.
IP2008JASA_Figure_04.png (661 × 531 pixels, file size: 10 KB, MIME type: image/png)
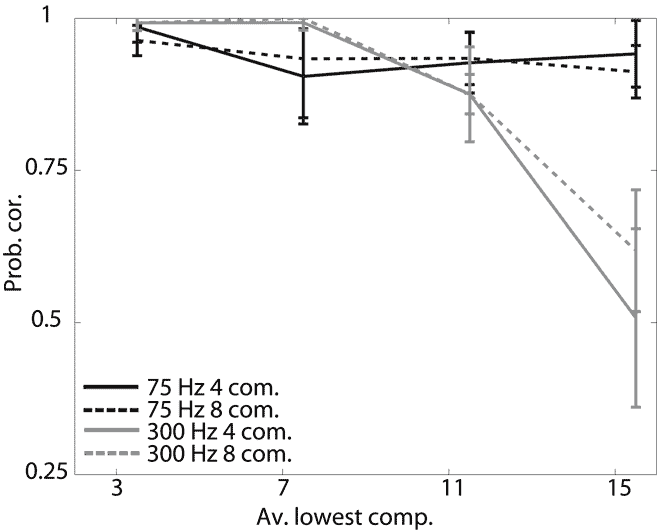
Performance on the melody task with the 75-Hz and 300-Hz fundamentals. The abscissa shows the average lowest component and the ordinate shows the probability of the listener correctly identifying the note which changed. Performance is plotted for each NC condition as a function of average lowest component. The black and grey lines show the results for the 75-Hz and 300-Hz F0s, respectively. The solid and dashed lines show the results for the four- and eight-harmonic stimuli, respectively.
File history
Click on a date/time to view the file as it appeared at that time.
| Date/Time | Thumbnail | Dimensions | User | Comment | |
|---|---|---|---|---|---|
| current | 13:55, 21 July 2008 | | 661×531 (10 KB) | Timives (Talk | contribs) | (Performance on the melody task with the 75-Hz and 300-Hz fundamentals. The abscissa shows the average lowest component and the ordinate shows the probability of the listener correctly identifying the note which changed. Performance is plotted for each NC) |
- Edit this file using an external application (See the setup instructions for more information)
File links
The following page links to this file: