File:KPSPLLcc03 fig1.PNG
From CNBH Acoustic Scale Wiki
No higher resolution available.
KPSPLLcc03_fig1.PNG (568 × 566 pixels, file size: 82 KB, MIME type: image/png)
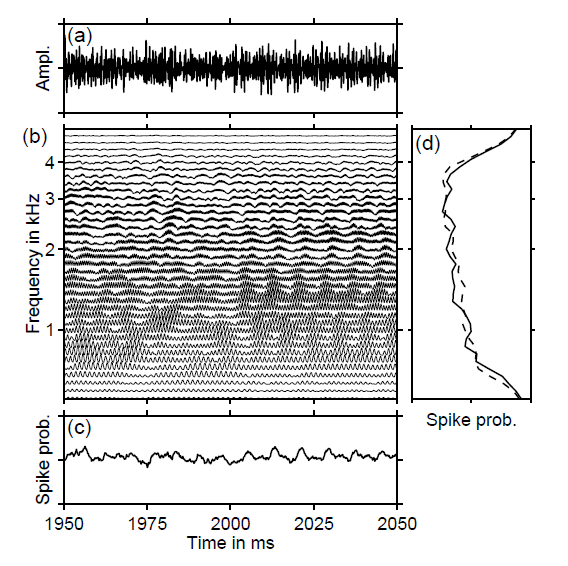
Fig.1: Simulated neural responses to a noise that comes on after 300 ms of silence (a) and a regular-interval sound that comes on after 300 ms of silence (b) and to a RI sound that comes after 300 ms of noise (c). Horizontal slices in the figure show time-interval histograms of neural activity (Patterson et al., 1995) as a function of time. The ordinate is time and the abscissa is the time interval between neural discharges; the strength of the response is represented by the darkness of the shading.
File history
Click on a date/time to view the file as it appeared at that time.
| Date/Time | Thumbnail | Dimensions | User | Comment | |
|---|---|---|---|---|---|
| current | 10:44, 10 September 2008 | | 568×566 (82 KB) | AlessandroB (Talk | contribs) |
- Edit this file using an external application (See the setup instructions for more information)
File links
The following page links to this file: