File:PUJGn02 fig2.PNG
From CNBH Acoustic Scale Wiki
No higher resolution available.
PUJGn02_fig2.PNG (549 × 574 pixels, file size: 194 KB, MIME type: image/png)
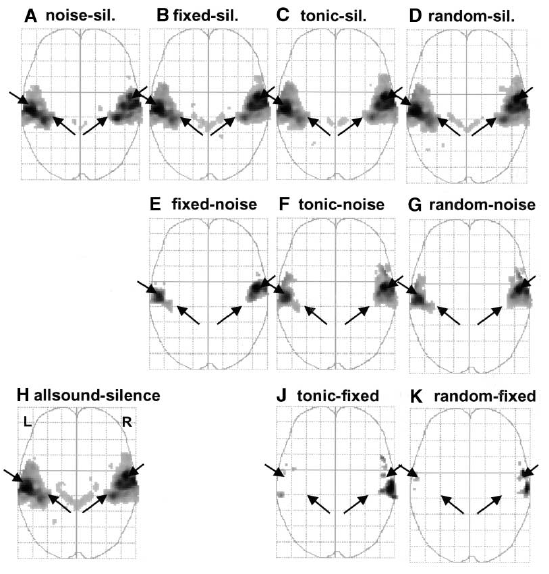
Fig.2: Axial projection of group activation in "glass brain" view for various contrasts: Top row: (A) noise vs silence, (B) fixed pitch vs silence, (C) diatonic melody vs silence and (D) random melody vs silence. Middle row: (E) fixed pitch vs noise, (F) diatonic melody vs noise and (G) random melody vs noise. Bottom row: (H) all sound conditions contrasted with silence. (J) diatonic melody vs fixed pitch and (K) random melody vs fixed pitch. The height threshold for activation was t=5.00 in every case (p<0.05 corrected for multiple comparisons across the whole volume). The arrows mark the approximate position of Heschl’s gyrus in the two hemispheres. The top row shows that these four types of sound produce activation in essentially the same cortical areas.
File history
Click on a date/time to view the file as it appeared at that time.
| Date/Time | Thumbnail | Dimensions | User | Comment | |
|---|---|---|---|---|---|
| current | 14:28, 10 September 2008 | | 549×574 (194 KB) | AlessandroB (Talk | contribs) |
- Edit this file using an external application (See the setup instructions for more information)
File links
The following page links to this file: