The robustness of human speech recognition to variation in vocal characteristics
From CNBH Acoustic Scale Wiki
Martin D. Vestergaard1, D. Timothy Ives1, Nicholas R. C. Fyson1,2 and Roy D. Patterson1
1 Centre for the Neural Basis of Hearing, Department of Physiology, Development and Neuroscience, University of Cambridge, Downing Street, Cambridge CB2 3EG, United Kingdom.
2 Bristol Centre for Complexity Science, Department of Engineering Mathematics, University of Bristol, Queen's Building, University Walk, Bristol BS8 1TR, United Kingdom.
Human speech recognition is remarkably robust to variation in vocal characteristics. The study reported in this letter sought to measure the robustness of syllable recognition over a large range of natural and unnatural voices simulated with a vocoder. The results show that once listeners had been trained on a set of 180 syllables uttered by one voice, recognition performance remains high for subsequent, novel voices from the same set. This is consistent with the hypothesis that the auditory system normalizes for much of the variability associated with speaker characteristics to enhance robustness. [92 words]
PACS numbers: 43.71.Bp 43.71.An, 43.66.Ba, 43.72.Qr
Contents |
Introduction
Speech is readily understood despite its inherent acoustic variability. A substantial portion of this variability arises from variation in speaker size and manifests itself as a change to the frequency configuration of speech formants. Specifically, children and women have shorter vocal tracts than adult men, and as a result the frequencies of their vocal tract resonances (which determine the formants) are higher (Fant, 1970; Fitch, 2000). Variability in speech also occurs due to differences in the rate at which the vocal folds vibrate. The vocal folds of adults are heavier and longer which results in lower glottal pulse rates (GPRs) (Titze, 1989). In spite of these differences in vocal characteristics, human speech recognition (HSR) is remarkably robust to speaker-size differences. Smith et al. (2005) showed that listeners could identify vowels scaled over a large range of vocal tract lengths (VTLs) and GPRs. Their study used five different vowels ([ɑː], [ɛː], [іː], [oː] [uː]), which were scaled with the STRAIGHT vocoder (Kawahara and Irino, 2004) to change the GPR and VTL of the voice. Some of the voices were highly abnormal, simulating speakers with values of GPR and VTL that the listeners would never have heard in real life. Recognition performance was high for vowels scaled within the normal range of GPR and VTL values, as well as for vowels scaled well beyond the normal range of experience. Vowels are specified by their formant frequencies, which are independent of GPR but which co-vary with VTL (Peterson, 1952; Fitch, 1997; Lee et al., 1999). To recognize a speech sound, listeners therefore need to normalize for phonetically irrelevant vocal characteristics like GPR and VTL (Nearey, 1989). This seems to be a trivial task for most listeners, which has led Irino and Patterson (2002) to suggest that the auditory system pre-processes sounds to detect and normalize for GPR and VTL, and it is these processes that lead to the robustness of HSR. This stands in marked contrast to results with Automatic Speech Recognition (ASR) systems (Potamianos et al., 1997; Monaghan et al., 2008a; Monaghan et al., 2008b). Potamianos et al. have shown that the performance of a conventional ASR system trained on adult voices degrades substantially when tested on speech uttered by children. In this paper, we extend the work of Smith et al. (2005) and use syllable phrases from the syllable corpus developed at the Centre for the Neural Basis of Hearing (CNBH) in Cambridge, United Kingdom. The CNBH syllable corpus contains 180 syllables and it has been used in a sequence of studies dealing with size perception (Ives et al., 2005), concurrent speech (Vestergaard, 2007) and brain imaging (von Kriegstein et al., 2006; von Kriegstein et al., 2007). In all of these studies, the syllables were scaled with the STRAIGHT vocoder (Kawahara and Irino, 2004) to simulate speakers with different vocal characteristics. Although there is a pronounced increase in stimulus variability, as the set expanded from 5 vowels to 180 syllables, we hypothesized that human recognition performance would remain largely independent of speaker characteristics. This would further support the hypothesis that the auditory system normalizes the variability associated with speaker characteristics and produces a size invariant representation of speech sounds.
Method
Listeners were first taught to operate a graphical user interface (GUI) developed for measuring syllable recognition (Vestergaard, 2007). This involved learning the orthographical representation of 180 syllables that were all played to the listeners using one particular voice. Subsequently, syllable recognition was tested for that voice as well as for eight markedly different voices.
Subjects
Thirty-eight listeners participated in the study (24 male and 14 female). Their average age was 21 years (17 – 33 yrs) and none of the subjects reported any audiological disorders. An audiogram was recorded at standard audiometric frequencies to ensure that the participants had normal hearing. The experiments were done after informed consent was obtained from the participants. The experimental protocol was approved by the Cambridge Psychology Research Ethics Committee (CPREC).
Procedure
The study consisted of two parts: (1) pre-experimental training on a reference voice, and (2) the main experiment on nine voices (eight new voices and the reference voice). The procedure was the same in both: the syllables were presented in triplets to promote perception of the stimuli as a phrase of connected speech as previously described by Vestergaard et al. (2007). Listeners indicated their answers by clicking on an orthographical representation of their chosen syllable from a response grid on a computer screen. The participants were seated in front of the response screen in an IAC double-walled, sound-attenuated booth, and the stimuli were presented via AKG K240DF headphones.
Stimuli
The experimental were taken from the CNBH syllable corpus previously described by Ives et al. (2005). It consists of 180 spoken syllables, divided into consonant-vowel (CV) and vowel-consonant (VC) pairs. There were 18 consonants, 6 of each of 3 categories (plosives, sonorants and fricatives), and each of the consonants was paired with one of 5 vowels spoken in both CV and VC combinations. The syllables were analyzed and re-synthesized with a vocoder (Kawahara and Irino, 2004) to simulate speakers with different combinations of GPR and VTL. Throughout the experiment the syllables were presented at 60 dB SPL.
Vocal characteristics
The reference voice used for training had a GPR of 172 Hz and a VTL of 14.7 cm. The combinations of GPR and VTL for the experimental voices are shown by the dots in Figure 1, which span an ellipse around the reference voice. The ellipse had a radius of 26% (4 semitones = ) along the GPR axis and 41% (6 semitones = ) along the VTL axis. The VTL dimension is proportionately longer because the just noticeable difference (JND) for VTL is at least 1.5 times the JND for GPR (Ives et al., 2005; Ritsma and Hoekstra, 1974). The voices were originally designed for a concurrent-speech experiment (Vestergaard, 2007), in which they were used as distracters. In all, there were nine different voices with the vocal characteristics shown in Table I.
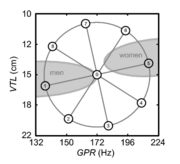
Table I. Vocal characteristics of the voices shown in Figure 1; see text for details.
| Voice number | 0 | 1 | 2 | 3 | 4 | 5 | 6 | 7 | 8 |
| GPR (Hz) | 172 | 137 | 152 | 180 | 209 | 215 | 194 | 163 | 141 |
| VTL (cm) | 14.7 | 15.8 | 19.7 | 20.6 | 17.7 | 13.6 | 11.0 | 10.5 | 12.2 |
Pre-experimental training
The listeners first had to learn the notation of the syllables used in the GUI and they had to learn to find the response syllables on the screen rapidly and with confidence. The target syllable was played in interval 3. The training comprised eight stages as shown in Table II. Each stage used a progressively larger subset of the syllables such that at the end of the training session, the entire syllable corpus was used. This was to introduce gradually the stimuli and their orthography. During training, performance criteria were used to ensure that the listener could perform the task for each subset of syllables before proceeding to the next stage. If a listener did not meet the criterion on a particular run, it was repeated until performance reached criterion. The training on the use of the GUI and the audiometric screening were performed in the first session of the experiment, which typically lasted two hours. The listeners returned on another day to part take in the main experiment.
Table II. Stages in the training regime. For example, at stage 3, the consonant was varied either in CV or VC format and it included all three consonant categories, so there were 18 response alternatives for each trial.
| Training stage | 1 | 2 | 3 | 4 | 5 | 6 | 7 | 8 |
| # trials | 20 | 20 | 20 | 20 | 20 | 30 | 30 | 30 |
| # alternatives | 5 | 6 | 18 | 30 | 90 | 180 | 180 | 180 |
| Variation | Vowel | Cons. | Cons. | All | All | All | All | All |
| CV/VC | Either | Either | Either | Either | Either | Both | Both | Both |
| Cons. category | All | Within | All | Within | All | All | All | All |
Main experiment
In the main experiment, recognition performance was measured for the eight experimental voices as well as for the reference voice used for training. To increase the sensitivity of the experiment to the variation in vocal characteristics, the task of identifying an unmasked syllable was made slightly more difficult by playing the target syllable in either interval 2 or 3. A visual indicator marked the interval to which the listener should respond. Each voice was sampled 40 times, and the trials were blocked in runs of 20 trials, within which the voice remained constant. Between runs the voice was randomly chosen from any of the nine voices. .
Results
Three measures of syllable recognition rate were analyzed: (1) percent correct, (2) d-prime, and (3) rationalized arcsine units (RAU) (Thornton and Raffin, 1978; Studebaker, 1985). The effects of training and vocal characteristics on these scores were analyzed with repeated measures analyses of variance (rm-ANOVA). For the training data, percent correct and d-prime scores were analyzed with a 1-way design [8 levels of progression during training]. D-prime scores quantify performance relative to chance performance, which decreased as the number of the syllable alternatives went up during training. In the main experiment, the full set of syllables was used, so there was no variation in response bias due to variation in chance level. Consequently, percent and RAU scores were analyzed. A 3-way rm-ANOVA was run to examine the effects of vocal characteristics and phonetic specification [9 (voices) × 2 (consonant-vowel orders) × 3(consonant categories)]. Paired comparisons with Sidak correction for multiple comparisons were used to localize the effects of vocal characteristics within the nine voices. Greenhouse-Geisser correction for degrees of freedom was used to compensate for lack of sphericity, and partial eta squared values (ηp2) are quoted below to report the effect sizes.
Training results
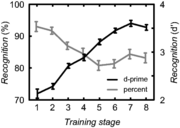
There was a significant effect of training stage for both performance measures: percent correct (F[7,105]=4.27, p=0.005, ε=0.54, ηp2=0.22) and d-prime (F[7,105]=52.85, p<0.001, ε=0.55, ηp2=0.78). The direction of the effect varied with the measure as illustrated in Figure 2. For the percentage scores, performance decreased from 93% to an average of 83% as the number of alternatives went up. At the same time, d-prime scores increased from 2.1 to 3.5 as the training progressed. Paired comparisons showed that there were no significant differences between stages 1 and 2 at the start of training, and between stages 6, 7 and 8 at the end of training, indicating that the effect occurs mainly between stages 2 and 6. During these stages the number of syllable alternatives increased from 6 to 180.
Main results
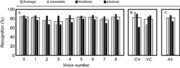
In the main experiment, the pattern of results was essentially the same for the two performance measures: percent correct and RAU. For the sake of brevity, we plot only the percent correct scores while the statistics reported below are for the RAU scores; the RAU statistics are arguably more prudent than the percent correct statistics. There were significant main effects for all three factors: voice (F[8,288]=9.89, p<0.001, ε=0.81, ηp2=0.22), consonant-vowel order (F[1,36]=10.77, p=0.002, ηp2=0.23), and consonant category (F[2,72]=88.36, p<0.001, ε=0.98, ηp2=0.71). Moreover, there were significant interactions of consonant category with voice (F[16,576]=3.18, p=0.001, ε=0.62, ηp2=0.81) and consonant-vowel order (F[2,72]=233.13, p<0.001, ε=0.86, ηp2=0.87). The directions of these effects are shown in Figure 3. For the experimental voices, the best performance (83%) was produced with voice 8, and the worst (73 %) with voice 3.
To examine whether performance for the reference voice in the main experiment was comparable with the final level of performance reached during the training session, the average score for the final 40 trials of the training session was compared with the score for the reference voice in the main experiment. Average performance for the reference voice in the main experiment was 83.4% and in the final stage of the training session it was 82.6%. This difference was not significant (F[1,36]=0.38, p=0.54, ηp2=0.01).
Discussion and Conclusion
During the training session, performance in terms of d-prime rose from just over 2 to around 3.5 normalized standard deviations. The recognition rate dropped from 93% correct to around 83% correct over this same period, as the number of alternatives increased from 5 to 180. The recognition score for the reference voice, when measured at the end of the training session, was the same as that when measured in the main experiment. These results illustrate that the listeners quickly learned to operate the GUI, and that once they reached the stage where the full syllable database was used, no additional learning was observed. Monaghan et al. (2008a; 2008b) tested recognition of the CNBH syllables with a conventional ASR system. The system was trained on voices similar to the reference voice and subsequently tested on a large range of voices including the experimental voices used in this experiment. They showed that performance was only robust to variation in GPR; recognition remained high for voices 1 and 5. For the other voices, which varied mainly in VTL, performance dropped to as low as 4% in some cases (Fig 5 in Monaghan et al., 2008a). The contrast between the HSR and ASR results on these matched tasks shows the value of the normalization processes applied by the auditory system. In the main experiment of the current study, there were main effects of voice and consonant-vowel order, which interacted with consonant category, as well as a main effect of consonant category. The size of the main effect for consonant category (ηp2=0.71) was much greater than that for voice (ηp2=0.22) or consonant-vowel order (ηp2=0.23). This suggests that it is the interaction with consonant category that drives the other main effects; this is also supported by the effect sizes for the interactions. Recognition rate dropped for plosive consonants for voices 2, 3 and 7, and for sonorant consonants for voice 3. Voices 3 and 7 are the most unfamiliar voices and have abnormally long and short VTLs, respectively. This may have led to the slight drop in recognition rate. The effect of consonant-vowel order also interacted with consonant category. For CVs, performance is worst for plosives, whereas for VCs, it was worst for sonorants. This confirms that the effects of voice and consonant-vowel order are driven primarily by plosive CVs and sonorant VCs. The present experiment has shown that scaling speech with a high-quality vocoder has little effect on the recognition of syllables from a large set of CVs and VCs. Once the listeners had learned to operate the experimental interface, recognition performance remained high for a variety of novel voices from the larger set. By contrast, an ASR system operating on the same database of syllables produces low recognition scores for voices with novel VTLs. Smith et al. (2005) showed that listeners were robust to the change of speaker characteristic for vowel sounds. The current study shows that listeners are still robust to these changes for more complex speech stimuli and a much larger response set.
Acknowledgements
The research was supported by the UK Medical Research Council [G0500221, G9900369]. We would like to thank James Tanner, Sami Abu-Wardeh, Charles Barter, Hamish Findlay, and Andy Taylor for help with collecting the data.
References
- Fant, G. C. M. (1970). Acoustic theory of speech production (Mouton, The Hague).
- Fitch, W. T. (1997). "Vocal tract length and formant frequency dispersion correlate with body size in rhesus macaques," J. Acoust. Soc. Am. 102, 1213-1222.
- Fitch, W. T. (2000). "The evolution of speech: A comparative review," Trends Cog. Sci. 4, 258-267.
- Irino, T., and Patterson, R. D. (2002). "Segregating information about the size and shape of the vocal tract using a time-domain auditory model: The stabilised wavelet-mellin transform," Speech Comm. 36, 181-203.
- Ives, D. T., Smith, D. R., and Patterson, R. D. (2005). "Discrimination of speaker size from syllable phrases," J. Acoust. Soc. Am. 118, 3816-3822.
- Kawahara, H., and Irino, T. (2004). "Underlying principles of a high-quality speech manipulation system straight and its application to speech segregation," in Speech separation by humans and machines, edited by P. L. Divenyi (Kluwer Academic, Massachusetts).
- Lee, S., Potamianos, A., and Narayanan, S. (1999). "Acoustics of children's speech: Developmental changes of temporal and spectral parameters," J. Acoust. Soc. Am. 105, 1455-1468.
- Monaghan, J. J. M., Feldbauer, C., Walters, T. C., and Patterson, R. D. (2008a). "Low-dimensional, auditory feature vectors that improve vocal-tract-length normalization in automatic speech recognition," in Proceedings of Acoustics'08 (Paris), pp. 477-482.
- Monaghan, J. J. M., Feldbauer, C., Walters, T. C., and Patterson, R. D. (2008b). "Low-dimensional, auditory feature vectors that improve vocal-tract-length normalization in automatic speech recognition," J. Acoust. Soc. Am. 123, 3066.
- Nearey, T. M. (1989). "Static, dynamic, and relational properties in vowel perception," J. Acoust. Soc. Am. 85, 2088-2113.
- Peterson, G. E. (1952). "The information-bearing elements of speech," J. Acoust. Soc. Am. 24, 629-637.
- Potamianos, A., Narayanan, S., and Lee, S. (1997). "Automatic speech recognition for children," in Proc. EUROSPEECH-1997 (Rhodos, Greece), pp. 2371-2374.
- Ritsma, R. J., and Hoekstra, A. (1974). "Frequency selectivity and the tonal residue," in Facts and models in hearing, edited by E. Zwicker and E. Terhardt (Springer, Berlin).
- Smith, D. R., Patterson, R. D., Turner, R., Kawahara, H., and Irino, T. (2005). "The processing and perception of size information in speech sounds," J. Acoust. Soc. Am. 117, 305-318.
- Studebaker, G. (1985). "A "Rationalized" Arcsine transform," J. Speech Hear. Res. 28, 455-462.
- Thornton, A. R., and Raffin, M. J. M. (1978). "Speech discrimination scores modeled as a binomial variable," J. Speech Hear. Res. 21, 507-518.
- Titze, I. R. (1989). "Physiologic and acoustic differences between male and female voices," J. Acoust. Soc. Am. 85, 1699-1707.
- Turner, R. E., Walters, T. C., and Patterson, R. D. (2004). "Estimating vocal tract length from formant frequency data using a physical model and a latent variable factor analysis," in British Society of Audiology Short Papers Meeting on Experimental Studies of Hearing and Deafness (UCL London), pp. P61.
- Vestergaard, M. D. (2007). "The effect of voicing, pitch and vocal tract length on the recognition of concurrent speech," J. Acoust. Soc. Am. 121, 3200.
- von Kriegstein, K., Smith, D. R., Patterson, R. D., Ives, D. T., and Griffiths, T. D. (2007). "Neural representation of auditory size in the human voice and in sounds from other resonant sources," Curr. Biol. 17, 1123-1128.
- von Kriegstein, K., Warren, J. D., Ives, D. T., Patterson, R. D., and Griffiths, T. D. (2006). "Processing the acoustic effect of size in speech sounds," Neuroimage 32, 368-375.